Know who uses the internet
Bandwidth by user, machine, app and site, next to the previous period.
Products Firewall
Bandwidth usage by user and application, blocks and VPN tunnel status, with no analyzer per vendor and no appliance.
30-minute demo · No per-device pricing
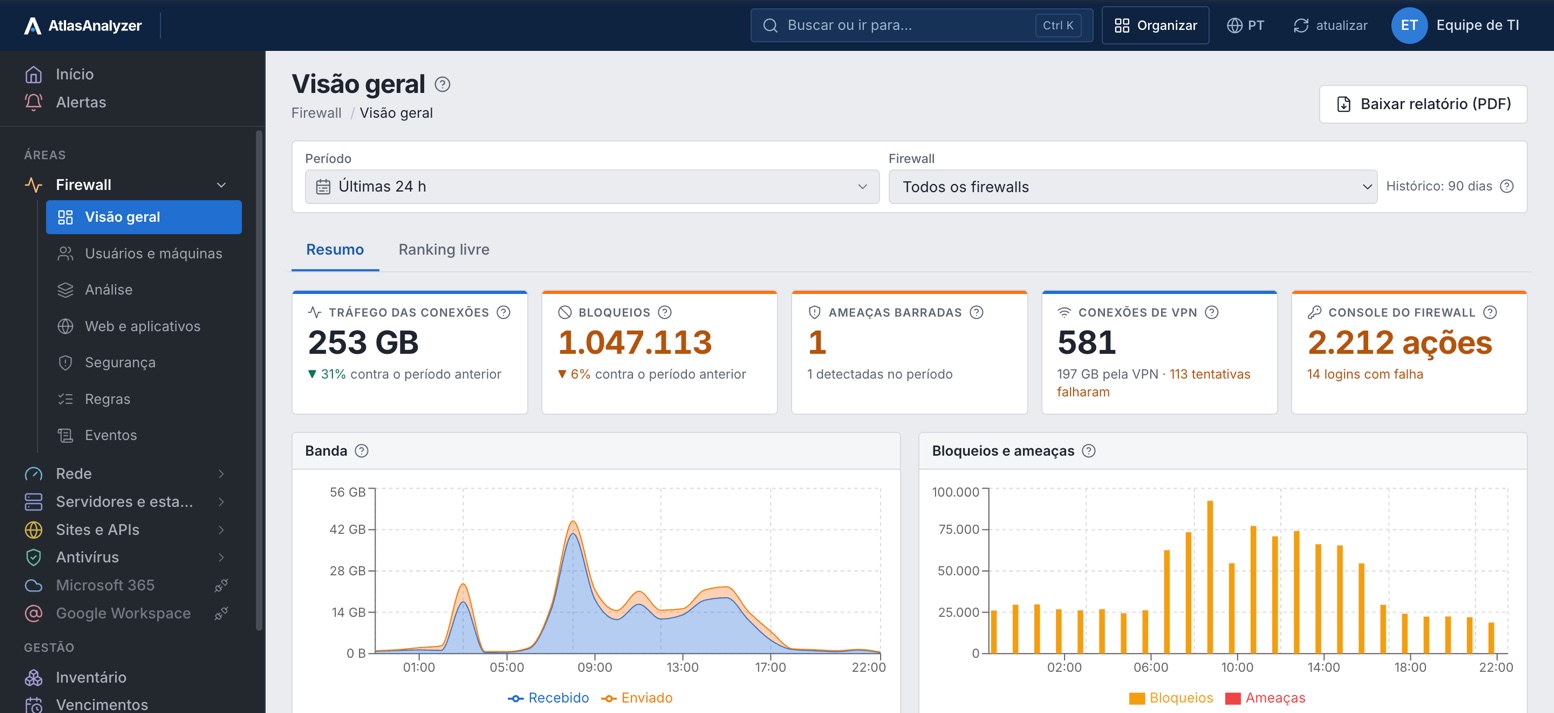



Bandwidth by user, machine, app and site, next to the previous period.
Blocked sites, categories, apps and connections, by whom and by which rule.
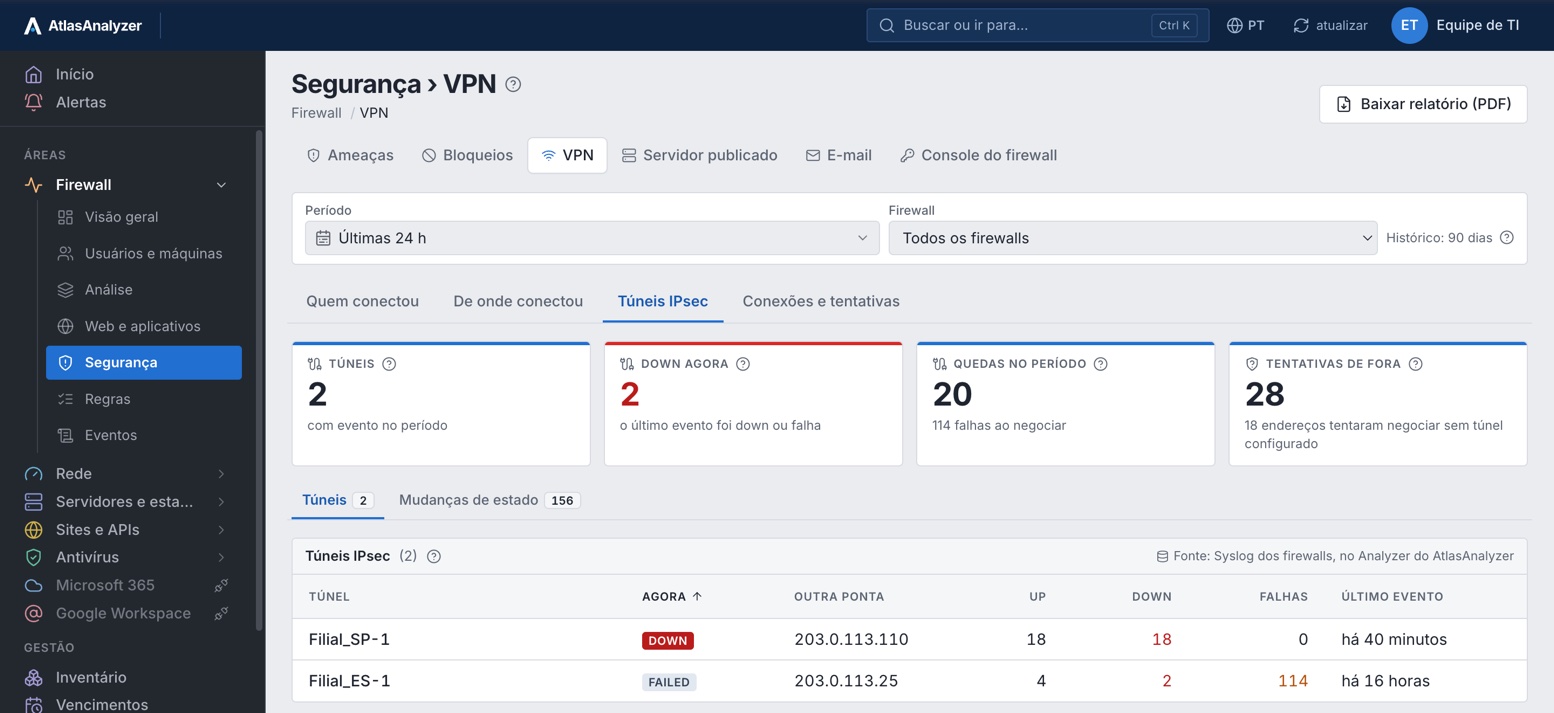
Tunnels up and down, negotiation failures and who connected, from where and for how long.
The period's PDF by email, scheduled, for management, HR or about one person.
Users and machines
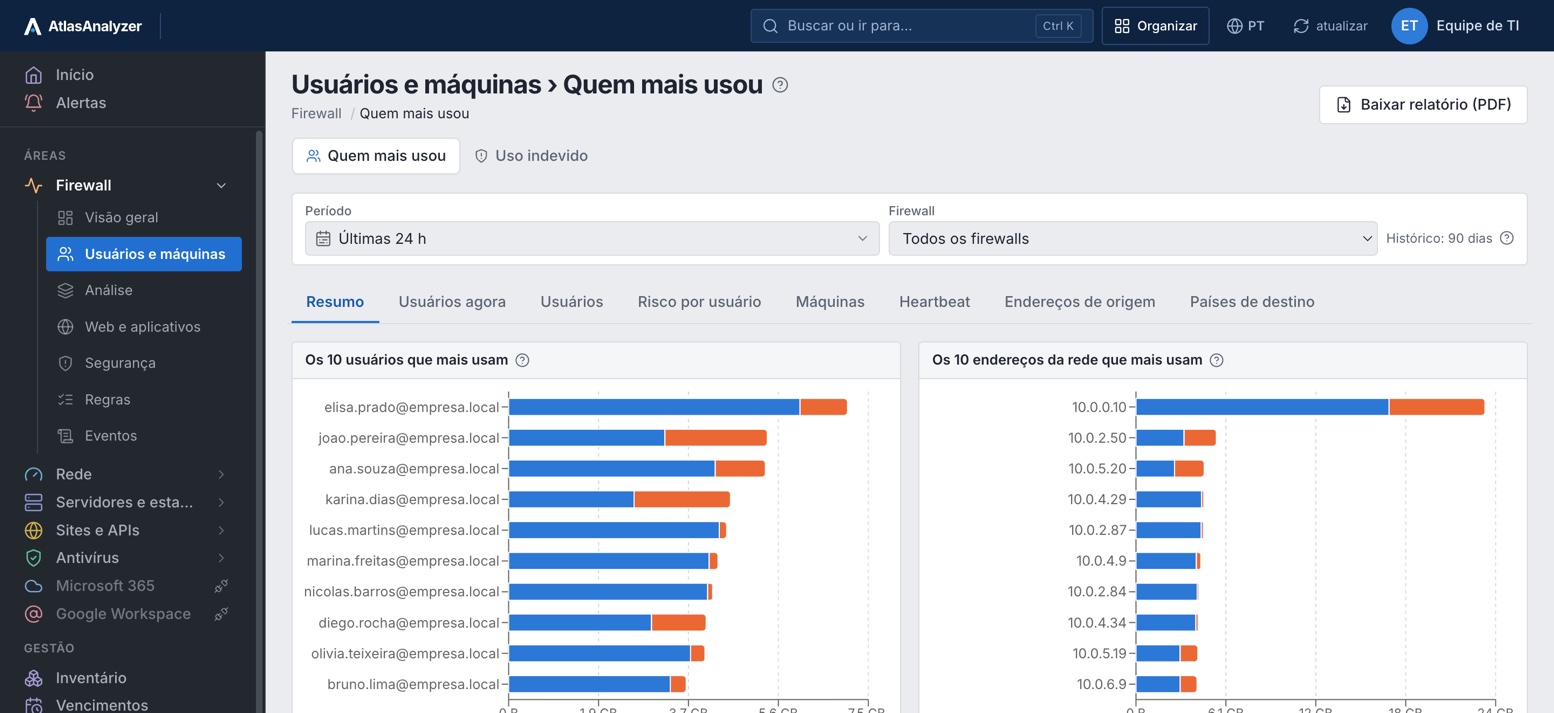
AtlasAnalyzer combines the logs from every firewall and shows the top bandwidth users, by user and by network address.
Web and apps
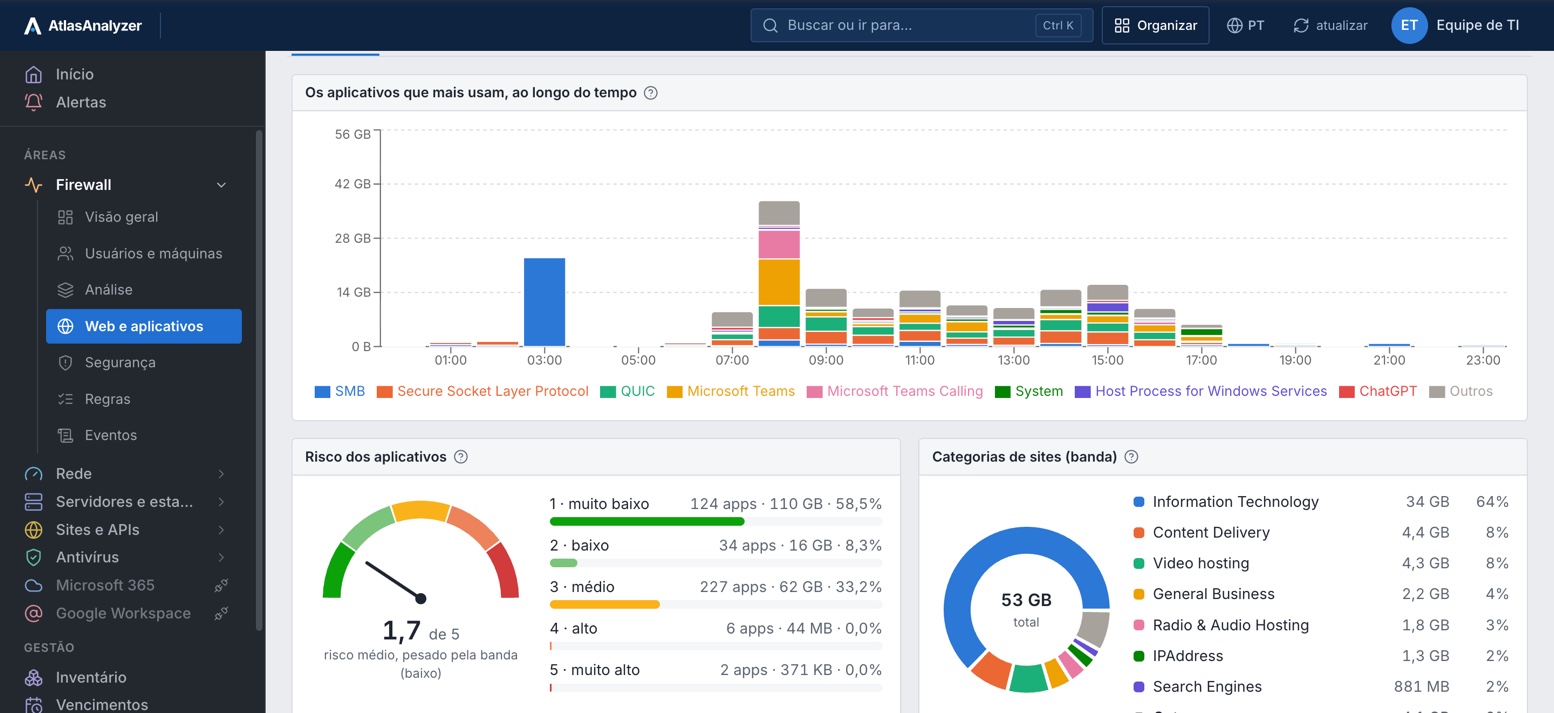
See where the bandwidth goes: apps throughout the day, site categories and what the firewall blocked in each.
One person's report
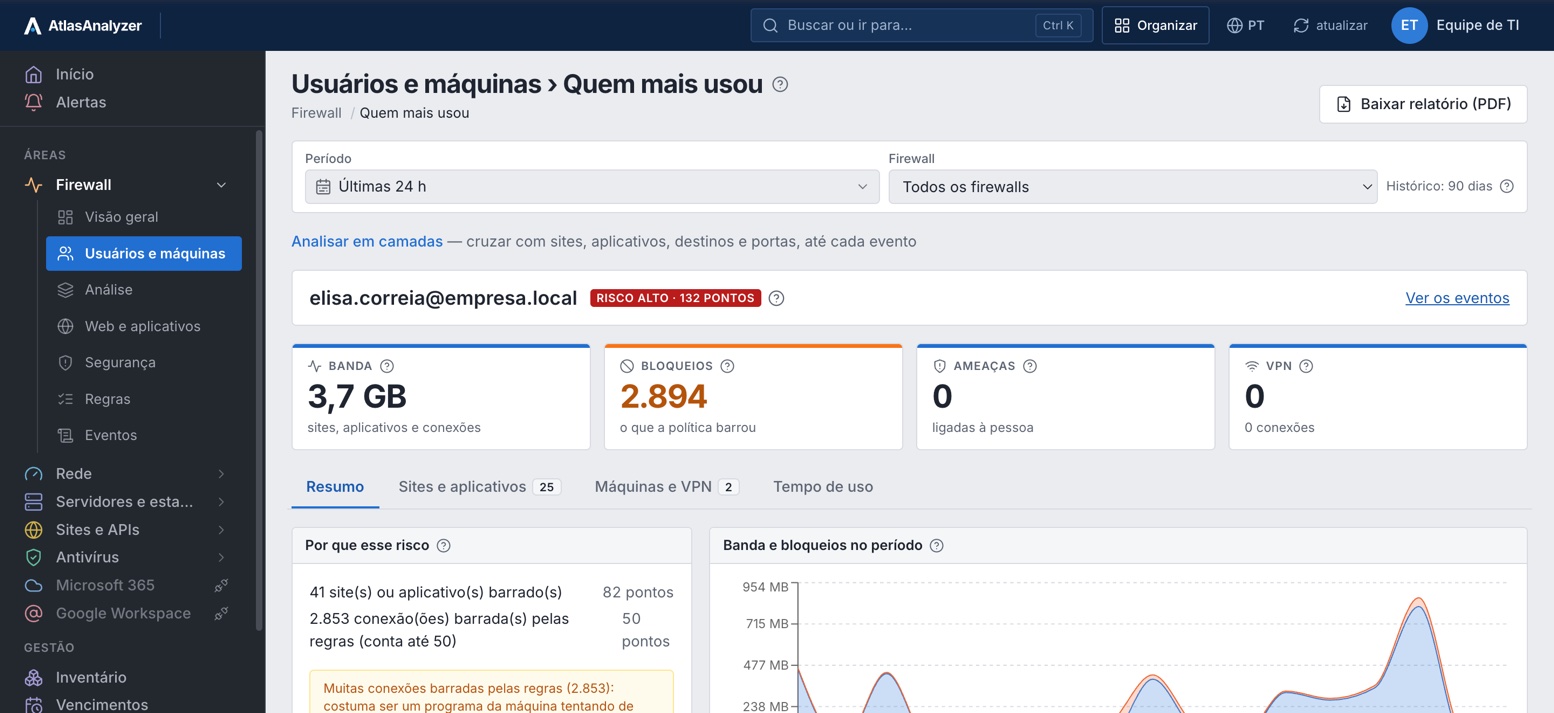
When HR or management asks, the answer is ready: bandwidth, blocks, sites, apps, machines, VPN and usage time in the period.
VPN
Each IPsec tunnel with its current status, the outages and negotiation failures in the period, and an alert when a tunnel goes down.
Rules
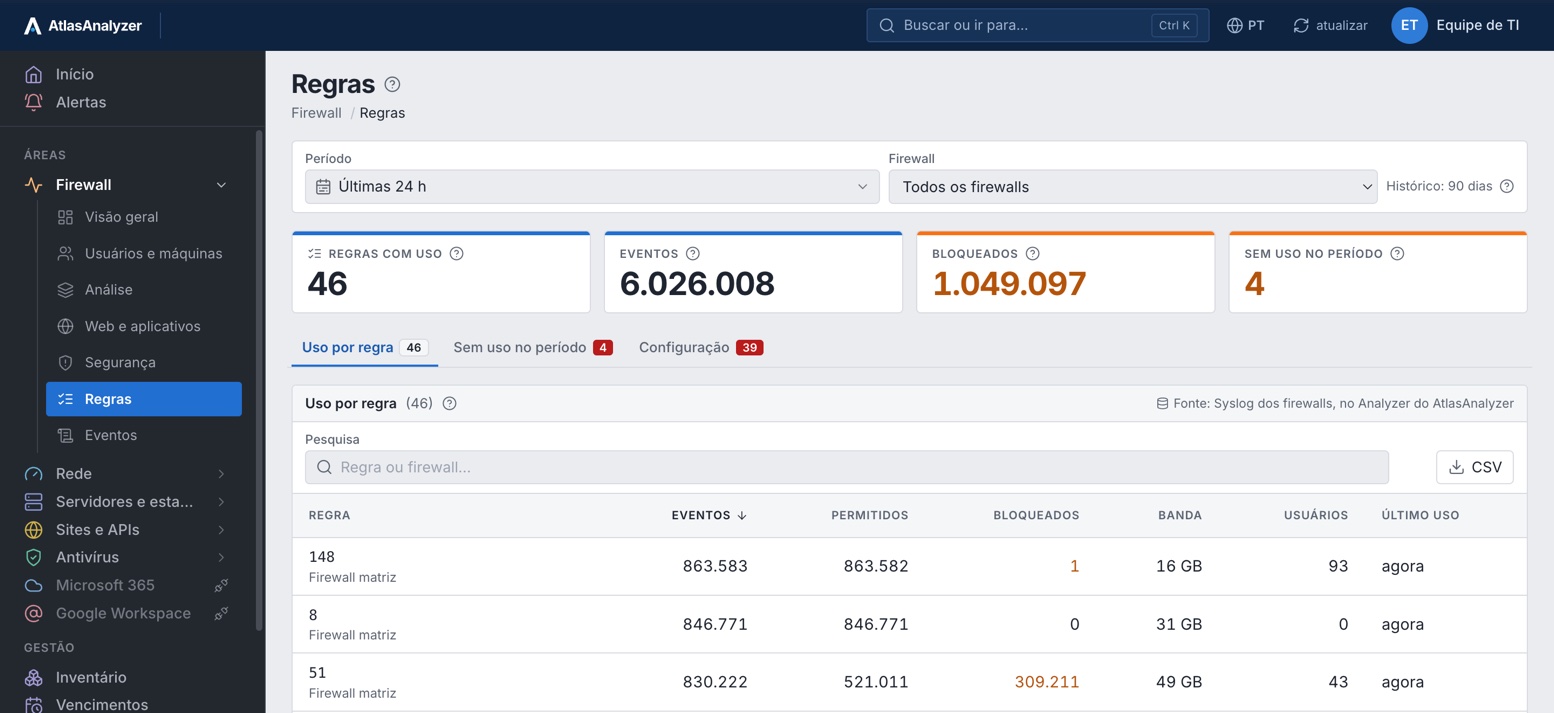
How many events and how much traffic each rule matched, how much it allowed and blocked, and the rules left unused.
See Firewall with your own environment's data
Everything AtlasAnalyzer pulls from your firewall's log, SNMP and API, in 37 features.
Bandwidth by user, application, destination and interface, compared with the previous period.
Who used the internet most, by user, machine and source address.
Everything about one user in the period: bandwidth, websites, apps, time spent, machines and VPN.
The most visited websites and categories, with the bandwidth of each and what was blocked.
The applications the firewall recognizes, with the bandwidth of each over the period.
How much time each person spent on each website and app.
Heat map of bandwidth and blocks by day of the week and hour.
Where the traffic goes, on a map by country.
Apps, websites, people and machines that appeared for the first time.
What the IPS, antivirus and web filter caught, on which machines and from where.
Where the attacks the firewall blocked come from.
Connections blocked by rule, access to the firewall itself, invalid traffic or DoS.
Inappropriate content, risky browsing and after-hours use: who, where and what got through.
The cloud services in use, with the risk the vendor assigns to each.
Messages that went through the firewall's filter, with spam, viruses and rejections.
Access to the systems published on the internet and what the firewall's WAF blocked.
An alert when the firewall's antivirus, IPS, web filter or ATP stops, read through the API.
Who connected, from where, for how long, how much traffic and the failed attempts.
Each tunnel up and down, the outages in the period and an alert when it goes down.
Availability of each internet link, SLA OK or breached, and the outages.
Active node changes, failed peer and configuration out of sync, with alerts.
Who logged in to the firewall console, from where, the failed logins and every change.
Events and traffic for each rule, what it allowed and blocked, and the rules left unused.
Protection services, rules that allow everything or have no logging, and the role of each link, read-only.
The expiration of each license and the firmware version, with an alert before it expires.
CPU, memory, sessions, temperature, fans, power supplies and interfaces of each firewall.
Firewall offline, syslog stopped, interface or tunnel down, HA, license, CPU and temperature, on your team's channel.
From the summary to the event: click any number to see who, what and through where.
Build any ranking you want, by any log field.
Every line the firewalls sent, with search across all events in the period.
In PDF, Excel or CSV, with ready-made templates, by email in the recipient's language.
The report with what ISO 27001, PCI DSS and LGPD usually ask of the firewall.
Read-only users can see people as codes instead of names.
From 30 days to 1 year of history, depending on the plan.
The firewall sends its log as one more syslog destination, over TLS or through the probe on the customer's network.
Health over SNMP and configuration through the API, with read-only credentials.
Sophos Firewall, Fortinet FortiGate, SonicWall, pfSense and MikroTik in the same console.
No appliance and no change to the firewall's configuration: it just gets one more syslog destination.
Through the probe on the customer's network, or straight to AtlasAnalyzer over TLS.
It reads each vendor's log line, counts it and keeps it for the plan's retention.
CPU, memory, sessions, HA, licenses and tunnels, read-only.
The screens, the scheduled PDF and alerts: VPN down, HA, no logs and expiring licenses.
Whatever the firewall does not send shows as not collected, never as zero.
Traffic, users, apps, web, threats, VPN and console
Health, HA, licenses and IPsec tunnels
Configuration: protection services, interfaces, rules, WAN links, tunnels and who is connected
Traffic, users, apps, web, threats, VPN and console
Health, sessions, HA, contracts and IPsec tunnels
System, licenses, FortiSwitch, FortiAP and Wi-Fi clients
Traffic, users, apps, web, threats, VPN and console
Health, connections and VPN associations
Version and SonicWave access points
Rules, connections, VPN and admin logins; no user, app or category
States, memory and disk (pfSense)
—
Logged rules, VPN and admin logins; no app or category
Version, temperature and memory
—
What AtlasAnalyzer collects from each firewall and how to connect it.
No. The firewall sends its logs through the probe, a lightweight program on a machine in your network, or straight to AtlasAnalyzer over TLS.
No. It only receives the logs and queries SNMP read-only; no rule, policy or setting is changed.
According to your plan: from 30 days to 1 year.
Yes. They all show up on the same screens, and the Firewall filter shows one at a time.
No. Their logs carry no user, app or site category; they show rules, connections, VPN and admin logins.
In a 30-minute demo, our team shows you AtlasAnalyzer with sample data from the sources you use.
