Full disks, days in advance
How much each partition grows per day and in how many days it fills up.
Products Servers and workstations
Availability, stopped services and filling disks with alerts, plus the sizing of every machine, through the AtlasAnalyzer agent.
30-minute demo · No per-device pricing
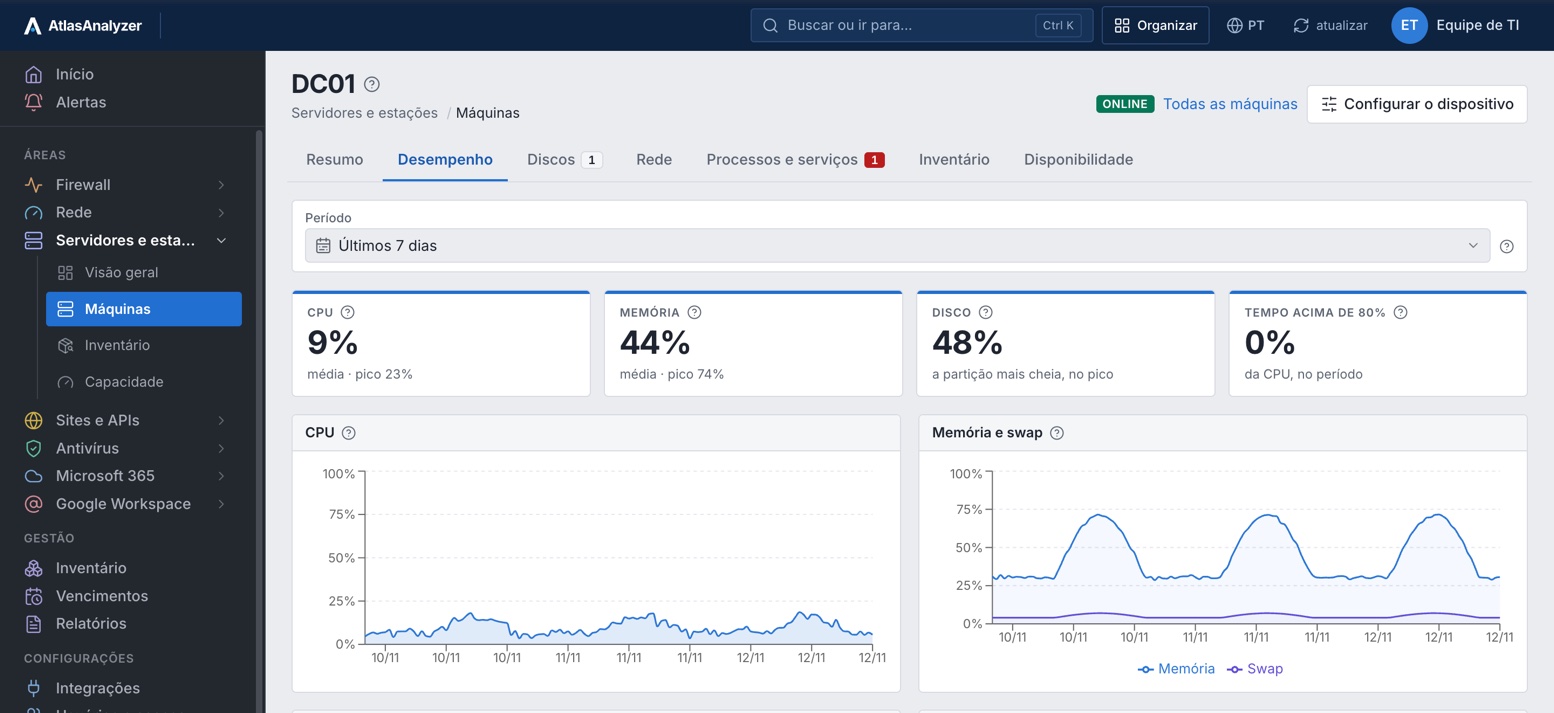


How much each partition grows per day and in how many days it fills up.
The services you choose and stopped automatic services, in your team's channel.
Undersized and oversized by CPU and memory, with the trend.
Hardware, OS and programs of each machine, updated every hour.
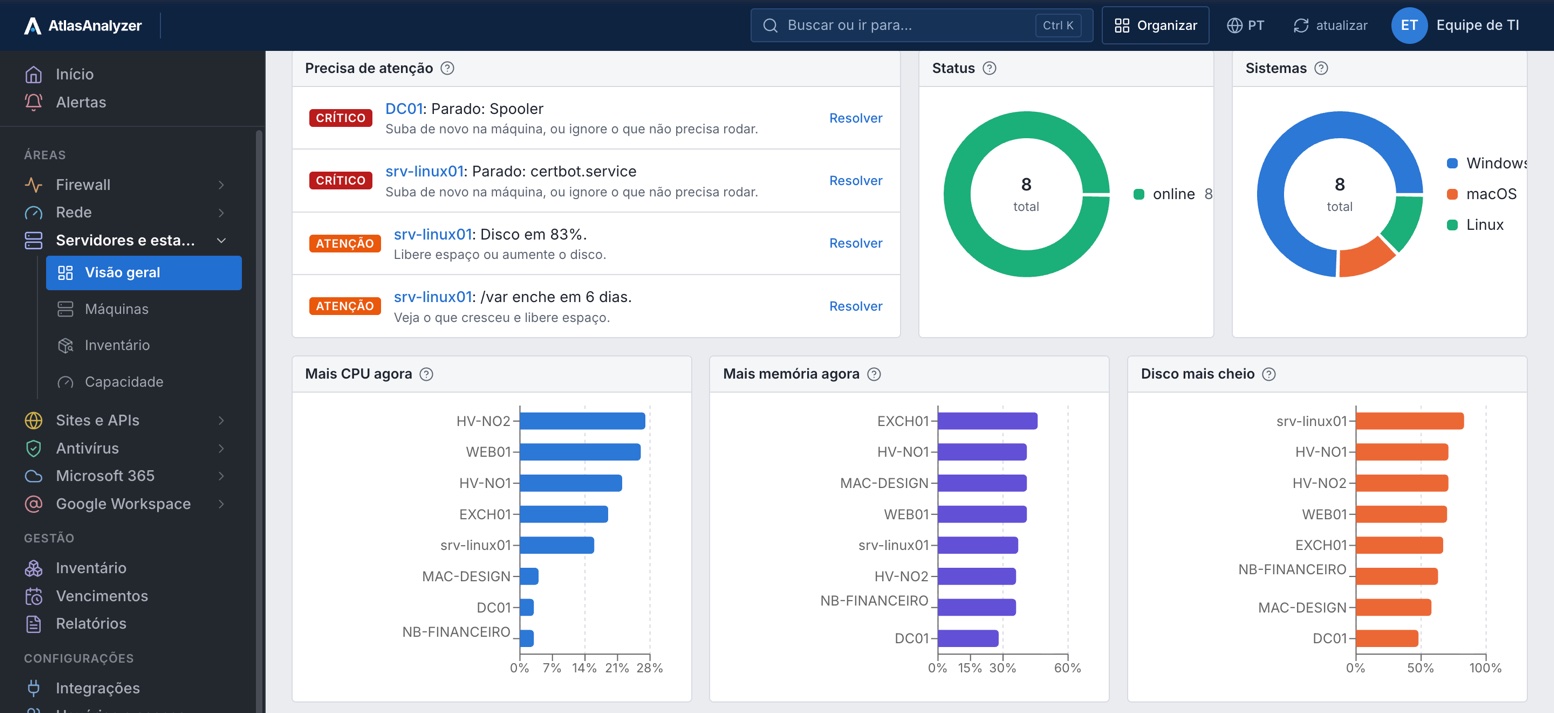
Overview
Stopped services, filling disks and offline machines in one list, with what to do for each item.
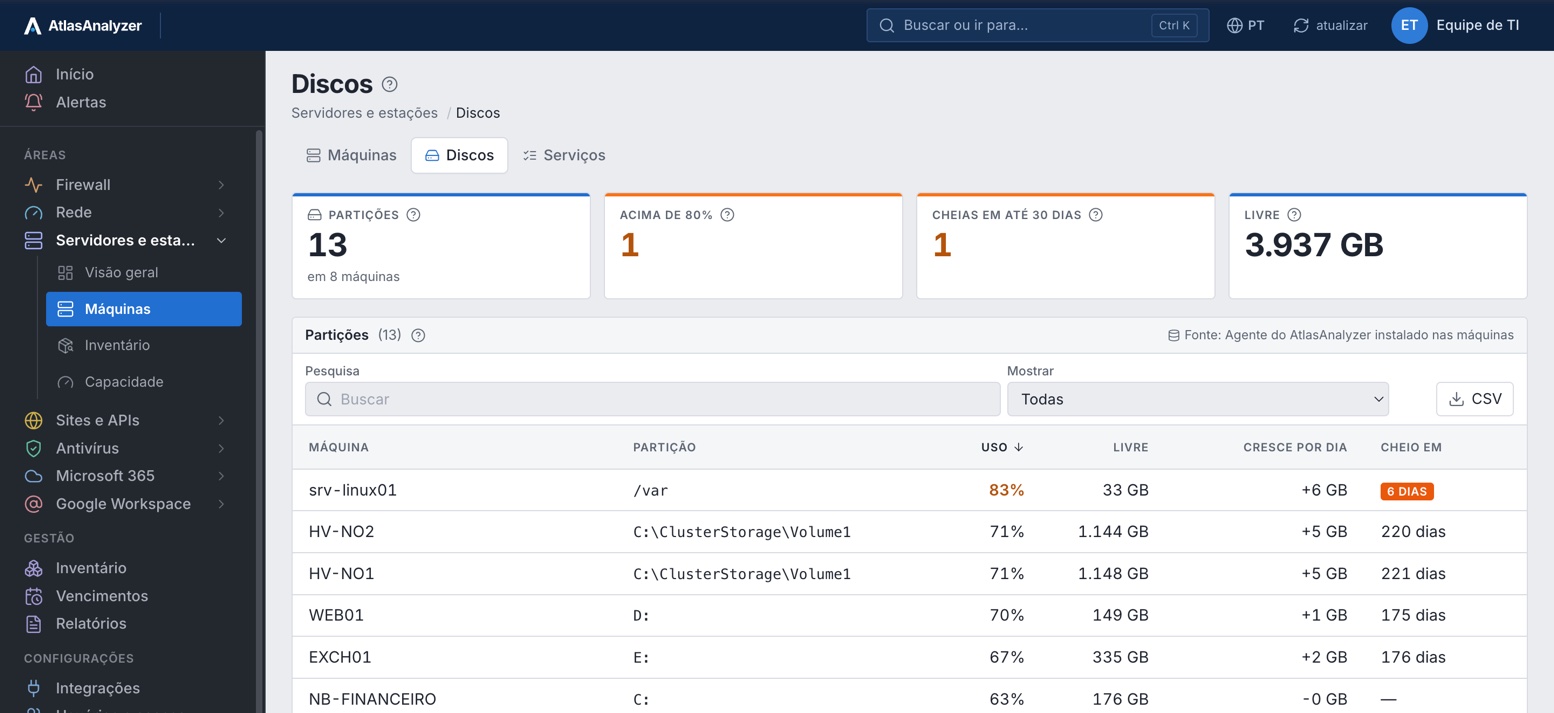
Disks
From the trend over the last 7 days, AtlasAnalyzer shows how much each partition grows per day and when it will fill up.
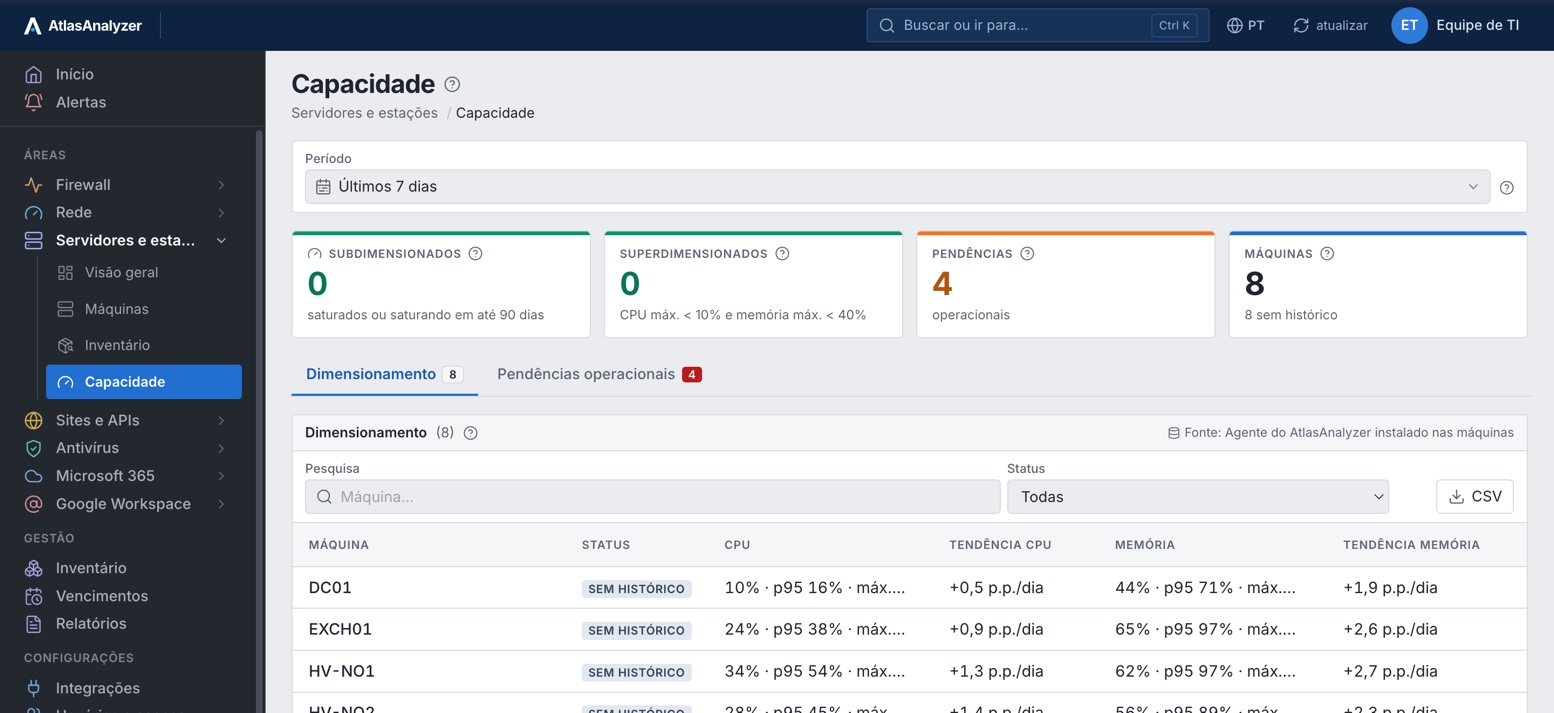
Capacity
Using the period's CPU and memory, each machine shows as undersized, oversized or OK, with the trend in p.p. per day.
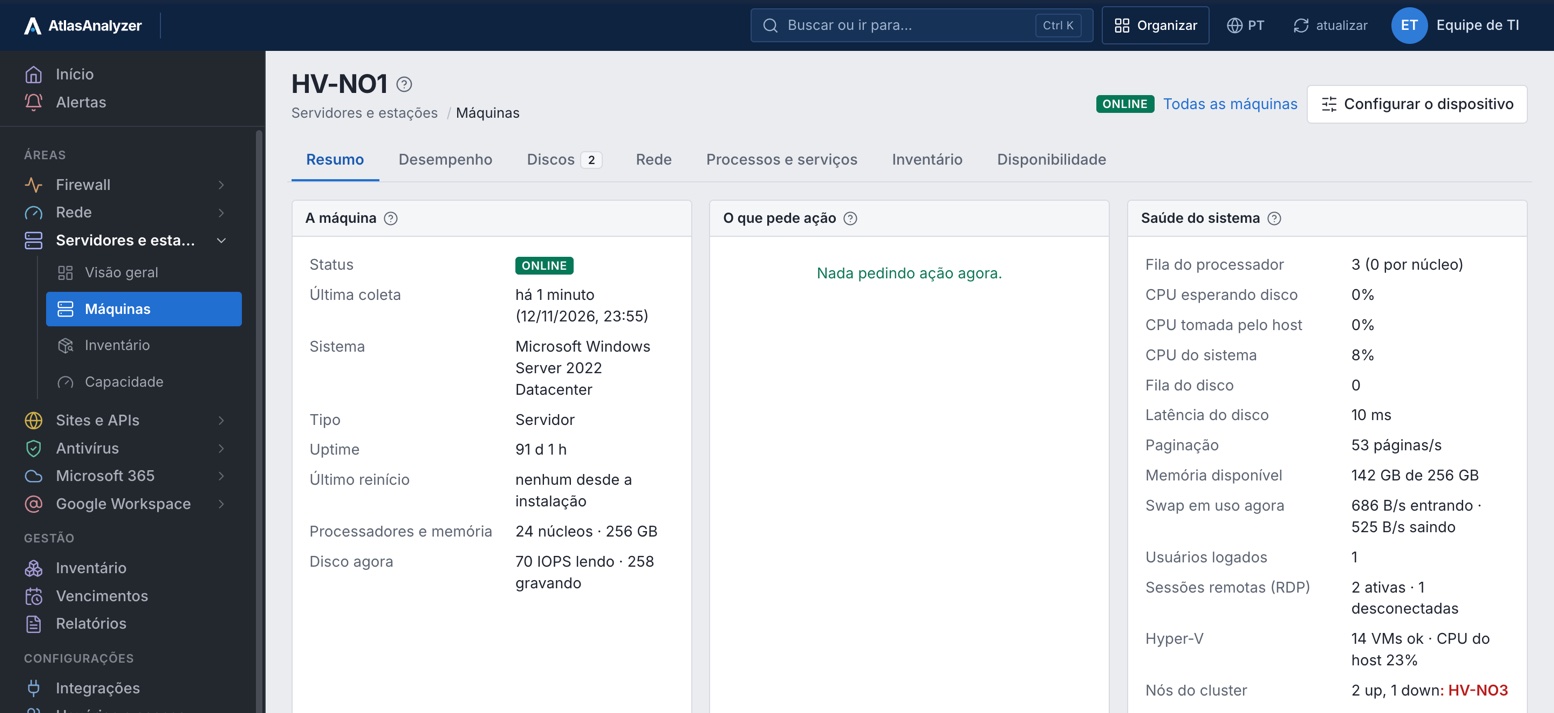
Machine details
System health, performance, disks, network, services and inventory, plus Hyper-V and the cluster when the machine has them.
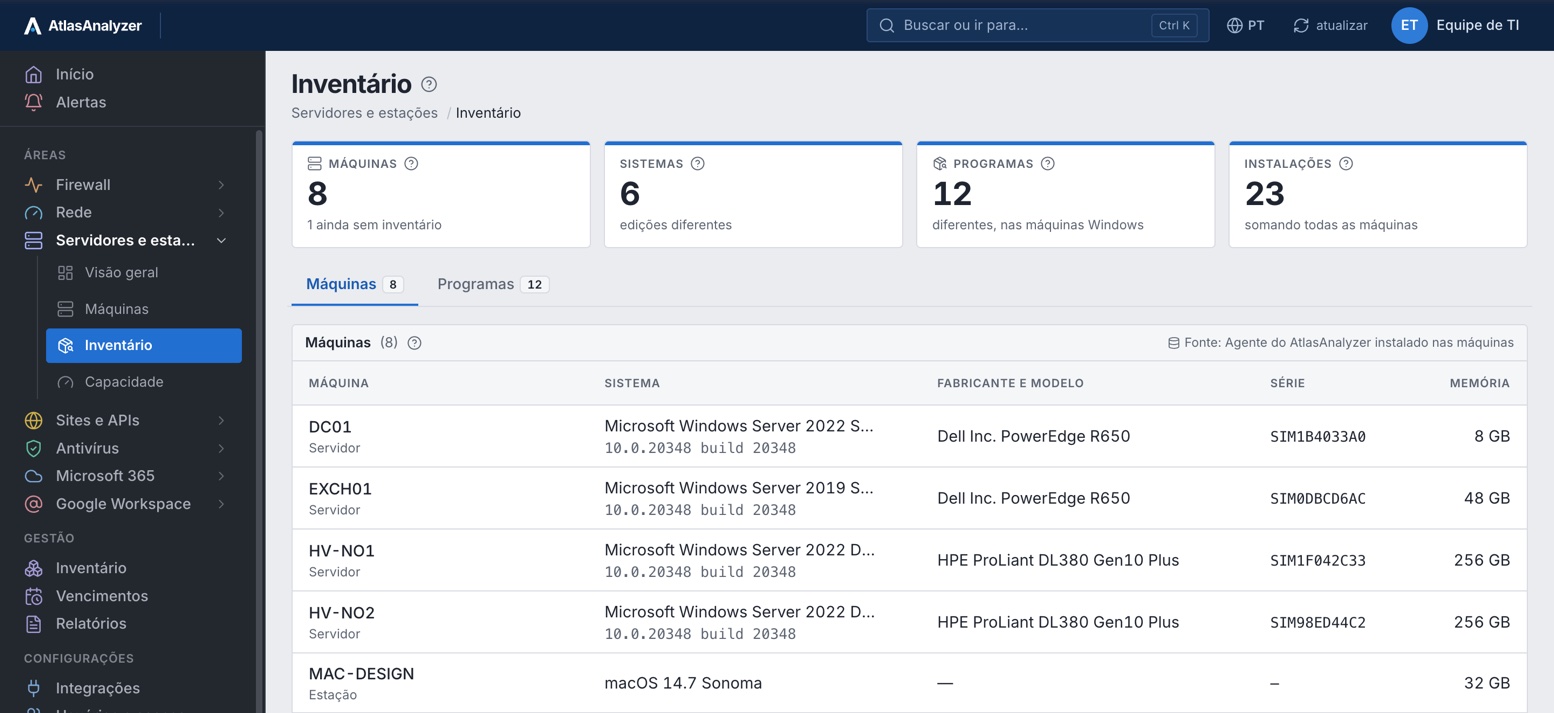
Inventory
Manufacturer, model, serial, OS, memory and installed programs of each machine, together on one screen.
See Servers and workstations with your own environment's data
Everything the AtlasAnalyzer agent tracks on your Windows, Linux and macOS servers and workstations, in 26 features.
Online and offline status, uptime and monthly availability of each machine, excluding scheduled maintenance.
CPU, memory, processor queue and network of each machine, with the period's history.
Traffic and errors on each adapter, with an alert when errors keep happening (cable, duplex, driver).
A workstation that goes silent for longer than the customer's chosen limit triggers an alert.
Usage of each partition, how much it grows per day and in how many days it fills up.
A Linux or macOS partition running out of inodes, which blocks writes even with free space.
Undersized and oversized machines by the period's CPU and memory, with the trend.
The processes and services you choose, with an alert when they stop.
On Windows, stopped automatic services; on Linux, failed systemd units.
The processes using the most CPU and memory, by name only, every minute.
Connections, requests per second, page life expectancy, blocked processes, deadlocks and offline databases, when SQL Server is on the machine.
The last full and log backup of each database, with an alert for a database without a full backup in 7 days or, in the FULL recovery model, without a log backup in 24 h.
The health of the virtual machines and the hypervisor's processor usage.
Connections and requests per second, stopped application pools and the ASP.NET queue, with alerts.
The domain controller's pending replications, with an alert when they fall behind.
The delivery queue and the poison queue, with an alert when they exceed the limit.
The status of each node and role, with the owner node, and alerts for node down and failed role.
Manufacturer, model, processor, memory, OS and installed programs on Windows, through WMI; OS and hardware on Linux.
How many installations and which versions of each program, and the machines by OS and model.
CPU, memory and disk thresholds per machine, with alerts on your team's channel.
High uptime, outdated agent or configuration and offline machines, in one list.
Each machine's period, ready to export: availability, outages, CPU, memory, disk, restarts and sizing.
One installer per OS, with the customer's code inside: whoever installs it types nothing.
GPO, Intune or script, with no prompts; if the agent is already running, it does nothing.
Runs without administrator rights, reads only its own machine, runs nothing, reads no logs and only goes out over HTTPS.
The configuration comes from AtlasAnalyzer and updates itself; if the contract is canceled, the agent removes itself.
A lightweight agent that only reads its own machine: it runs nothing, reads no logs and opens no ports.
Windows, Linux or macOS, with the customer code built in: whoever installs types nothing.
By hand, via GPO, Intune or script, with no prompts.
Each machine's services and thresholds; the configuration reaches the agent on its own.
The screens, alerts in your team's channel and the machines summary to export.
A closed list, the same for every customer: anything not on it is not read.
CPU, memory, processor queue, disks, network and uptime
Chosen services, stopped automatic services and top consumers
Hardware, OS and programs, via WMI
SQL Server, Hyper-V, IIS, AD, Exchange and failover cluster, only when present on the machine
IIS pools, Exchange queues, AD replication and cluster roles
—
CPU, memory, disks, network and uptime
Chosen services and top consumers
Hardware, OS and programs, via WMI
CPU, memory, disks, inodes, network and uptime
Chosen processes, failed systemd units and top consumers
OS and hardware, from a closed list of files
CPU, memory, disks, inodes, network and uptime
Chosen processes and top consumers
—
Temperatures, fans, power supplies, consumption and disks, from the board (iDRAC, iLO, XClarity)
—
Model and serial number
No. On Windows it runs as LocalService and on macOS as nobody, without administrator privileges.
No. It only reads the closed list of metrics, without running anything or reading logs.
No. The agent only connects outbound, over HTTPS, to AtlasAnalyzer.
As many as your plan includes; for more, expand your contract.
The daily task the installer leaves on the machine removes the agent itself.
In a 30-minute demo, our team shows you AtlasAnalyzer with sample data from the sources you use.
