Every alert in one place
Network, servers, sites, firewall and the other areas, with source and severity.
Products Alerts and NOC
Every alert goes to whoever is on call, by WhatsApp, SMS, Teams or email; with no response, it escalates to the next person. Scheduled maintenance windows suspend alerts.
30-minute demo · No per-device pricing
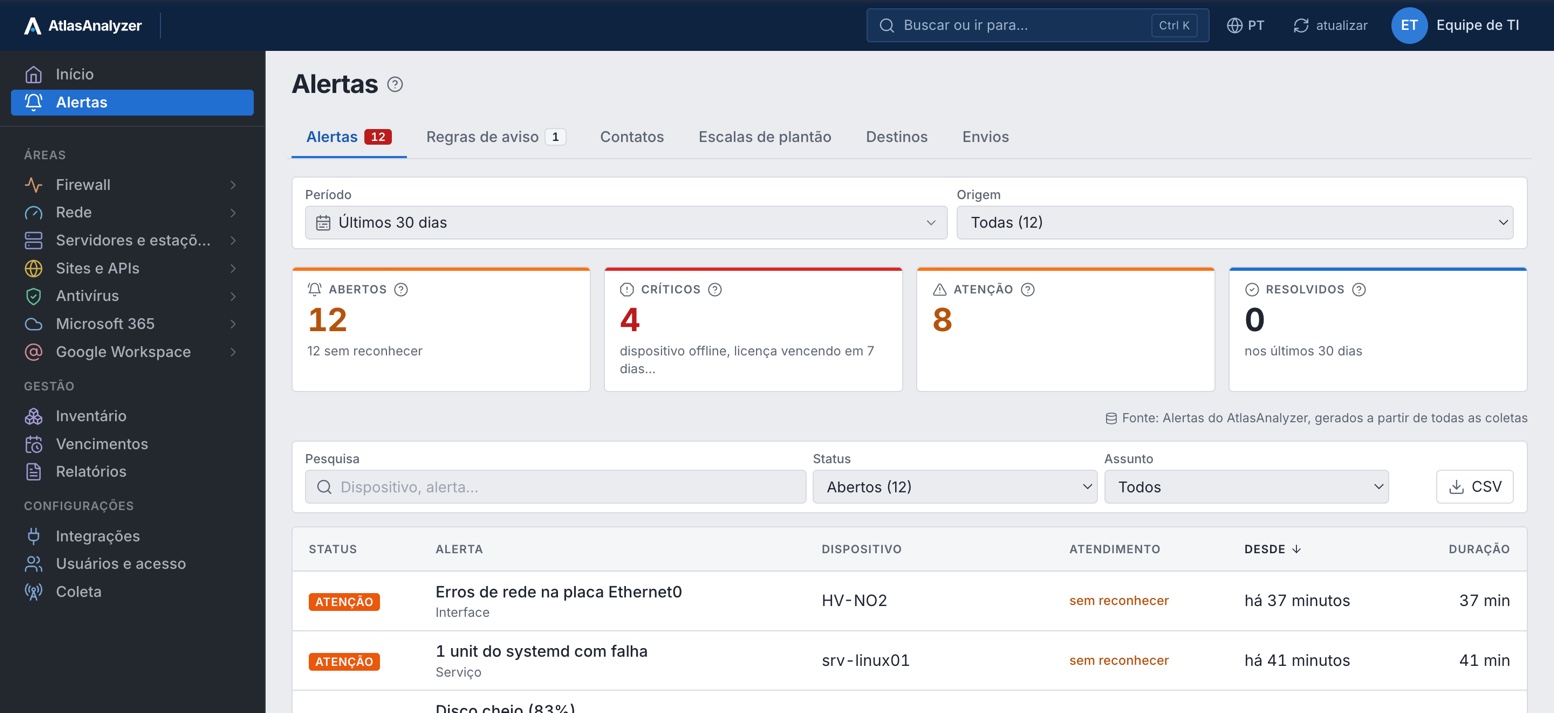
Network, servers, sites, firewall and the other areas, with source and severity.
Only the root cause notifies, a flapping link doesn't, and maintenance opens no alerts.
Notification rules, on-call schedules and escalation when nobody acknowledges.
In GLPI, Tiflux, Milvus, Movidesk, HaloPSA, ConnectWise or Autotask.
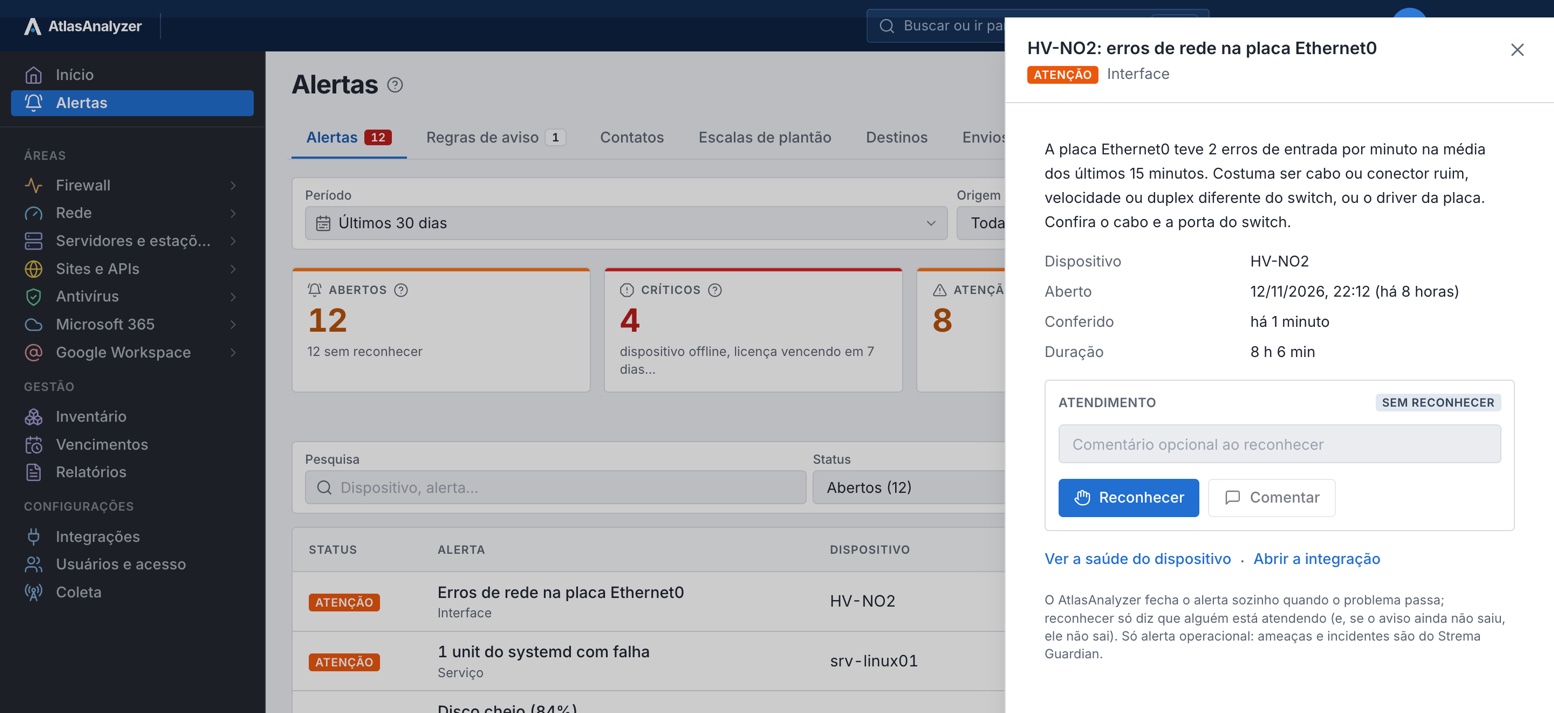
Alert center
What happened, the likely cause and what to check, with who took it and the comments until it's resolved.
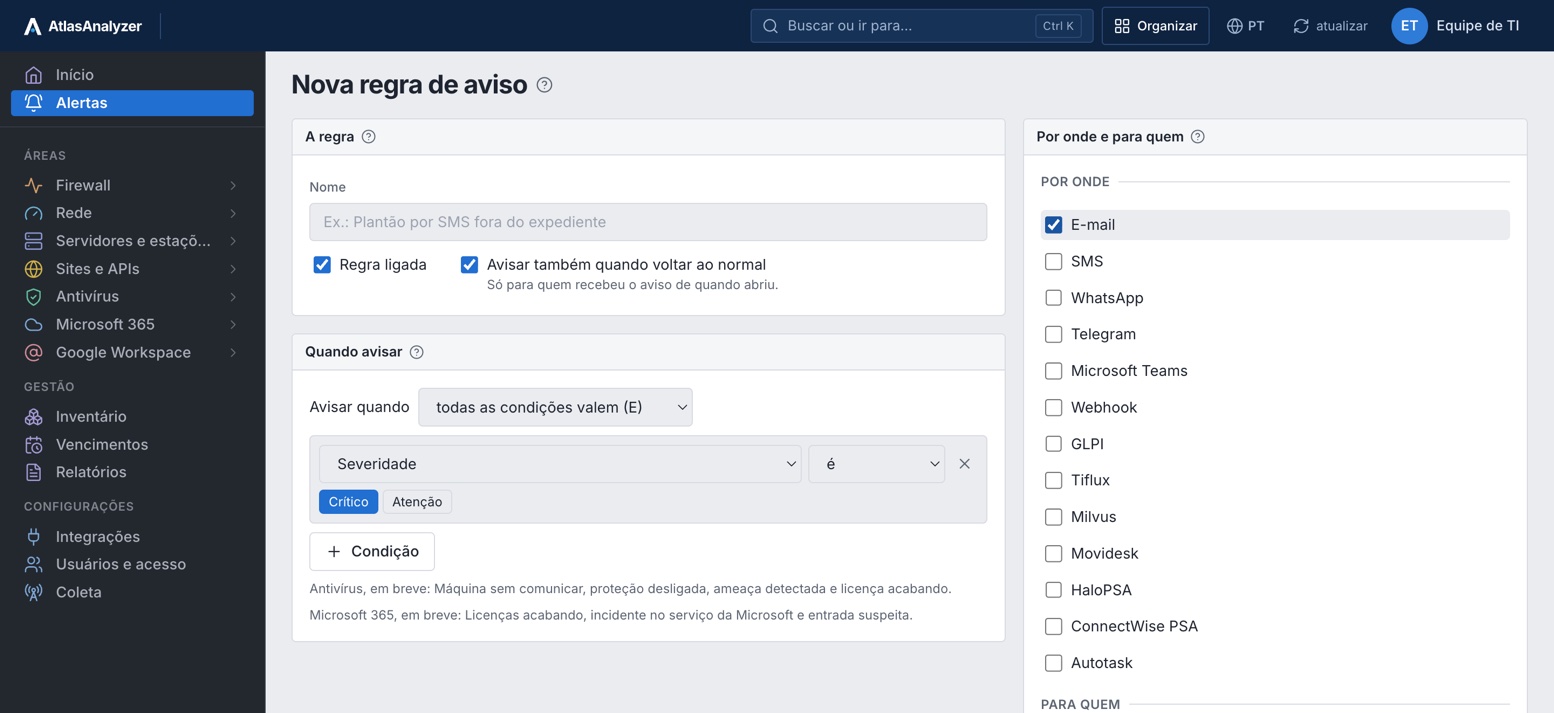
Notification rules
Combine area, trigger, severity, device, text, day and time, and choose the channels and recipients.
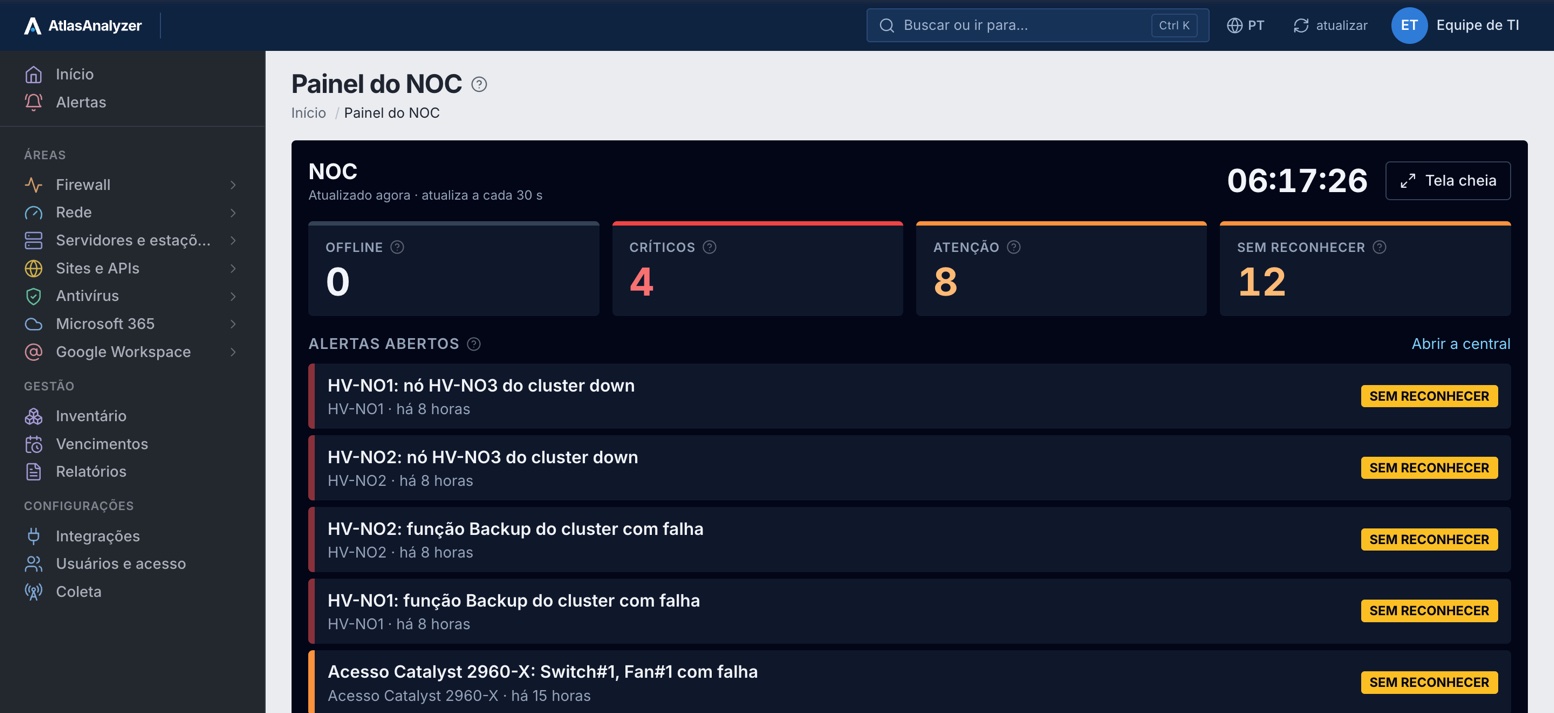
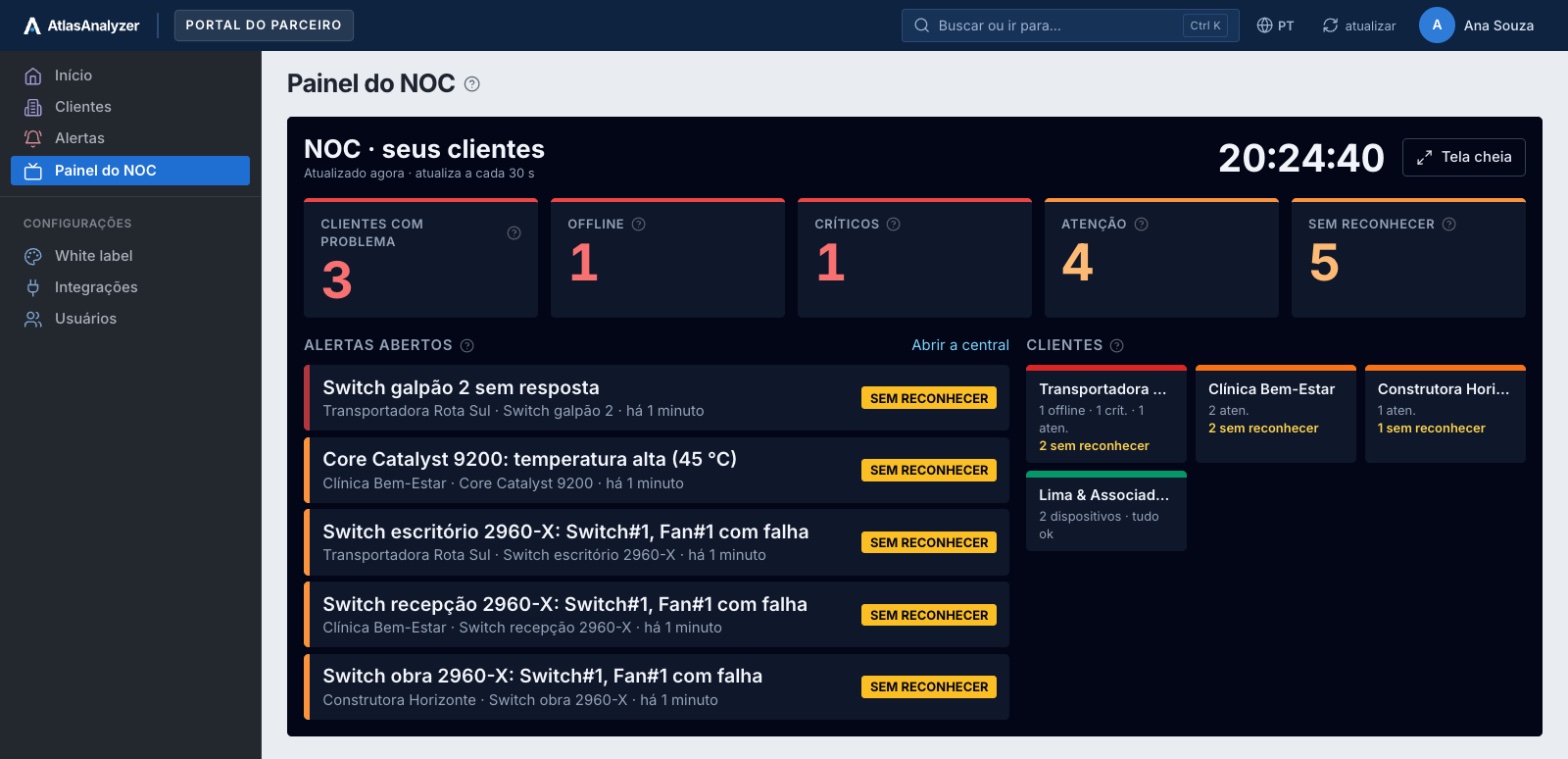
NOC panel
For the video wall: what's offline, critical, needs attention and hasn't been acknowledged, refreshed every 30 seconds.
For MSPs
The partner sees every customer's alerts in one place, with a portfolio NOC and one ticketing system for all.
See Alerts and NOC with your own environment's data
Everything AtlasAnalyzer does with alerts from every area, from notification to ticket, in 26 features.
Alerts from every source together, with each one's source, severity and status.
The alert opens when the problem appears and is resolved when the device recovers.
Who took each alert, the comments and the history until it was resolved.
When the firewall is offline, the devices behind it do not notify: only the root-cause alert gets through.
Device offline, interface, VPN and SD-WAN link down, SLA breached on a link, HA, license expiring and syslog stopped.
CPU, memory, disk full or filling up, service stopped, IIS, AD, Exchange, cluster, SQL Server low on memory, blocking, database offline or backup overdue and Hyper-V VM critical.
Offline, slow, out of the ordinary, certificate and domain expiring and monthly SLA breached.
Protection stopped, antivirus out of date and machine not communicating with the console.
Service down or degraded, licenses used up, subscription expiring and AD sync stopped.
Your own, on any of the 61 collected metrics (link usage, SQL Server connections, toner, UPS runtime), with a preview of the last 24 h.
Who is notified and when, combining area, trigger, severity, device, text, day and time.
Email, SMS, WhatsApp, Telegram, Microsoft Teams and webhook.
If nobody acknowledges in time, the notification moves up to the next person on call.
The alert must stay open for a few minutes: a link that flaps and comes back does not notify.
Whoever was notified of the problem is also notified when it recovers.
Each contact receives notifications in their own language and time zone.
What was sent, to whom, through which channel and whether it arrived.
The alert opens a ticket in GLPI, Tiflux, Milvus, Movidesk, HaloPSA, ConnectWise or Autotask, with priority based on severity.
Ownership and escalation become ticket updates, and the resolution goes to the ticket when the alert is resolved.
Windows in which devices neither open alerts nor count against availability.
CPU, memory, disk, inodes, queues, SQL Server, Hyper-V, latency and loss with each device's own threshold.
Full screen for a video wall, refreshed every 30 seconds, with what is offline and what nobody has acknowledged.
The average time to acknowledge and to resolve alerts, for the period and in reports.
For every device, link and website, ready for the monthly report.
The partner sees alerts from all customers in one place, with a portfolio-wide NOC.
One ticketing system for the whole portfolio, with each customer's entity or account.
Operational alerts: device offline, VPN down, disk full, license expiring.
Each collection opens and closes its own, with each device's thresholds.
What notifies, through which channel and to whom.
Rotation or shifts, with overrides; without acknowledgment, the notice escalates.
The alert becomes a ticket, and the ticket follows the alert.
Every send is logged: what, to whom, through which channel and whether it arrived.
Opening and resolved notices, in the recipient's language
A short message with the device and what happened
The notice through AtlasAnalyzer's message template
The notice in a group or to a person
A card in your team's channel, colored by severity
Signed JSON (HMAC-SHA256) for opened, acknowledged, escalated and resolved
GLPI, Tiflux, Milvus, Movidesk, HaloPSA, ConnectWise PSA and Autotask: opens a ticket with priority by severity; acknowledgment and escalation become follow-ups, and the resolution is posted when the alert resolves
Yes. When the device returns to normal, the alert is resolved, and whoever was notified gets the resolved notice.
A rule can wait a few minutes before notifying: anything that recovers in that time doesn't notify.
No. AtlasAnalyzer is about observability: its alerts are operational.
Yes. The partner sees alerts across the whole portfolio and uses one ticketing system for every customer.
In AtlasAnalyzer Monitor and in Analytics.
In a 30-minute demo, our team shows you AtlasAnalyzer with sample data from the sources you use.
