Know before your customer does
An offline device, interface down or closed port becomes an alert within 3 minutes.
Products Network
Links, switches, Wi-Fi and UPS units with alerts before the customer calls, the network map, the monthly SLA and the saturation forecast.
30-minute demo · No per-device pricing






An offline device, interface down or closed port becomes an alert within 3 minutes.
The topology comes from what devices already know: SNMP, LLDP, ARP and the APIs.
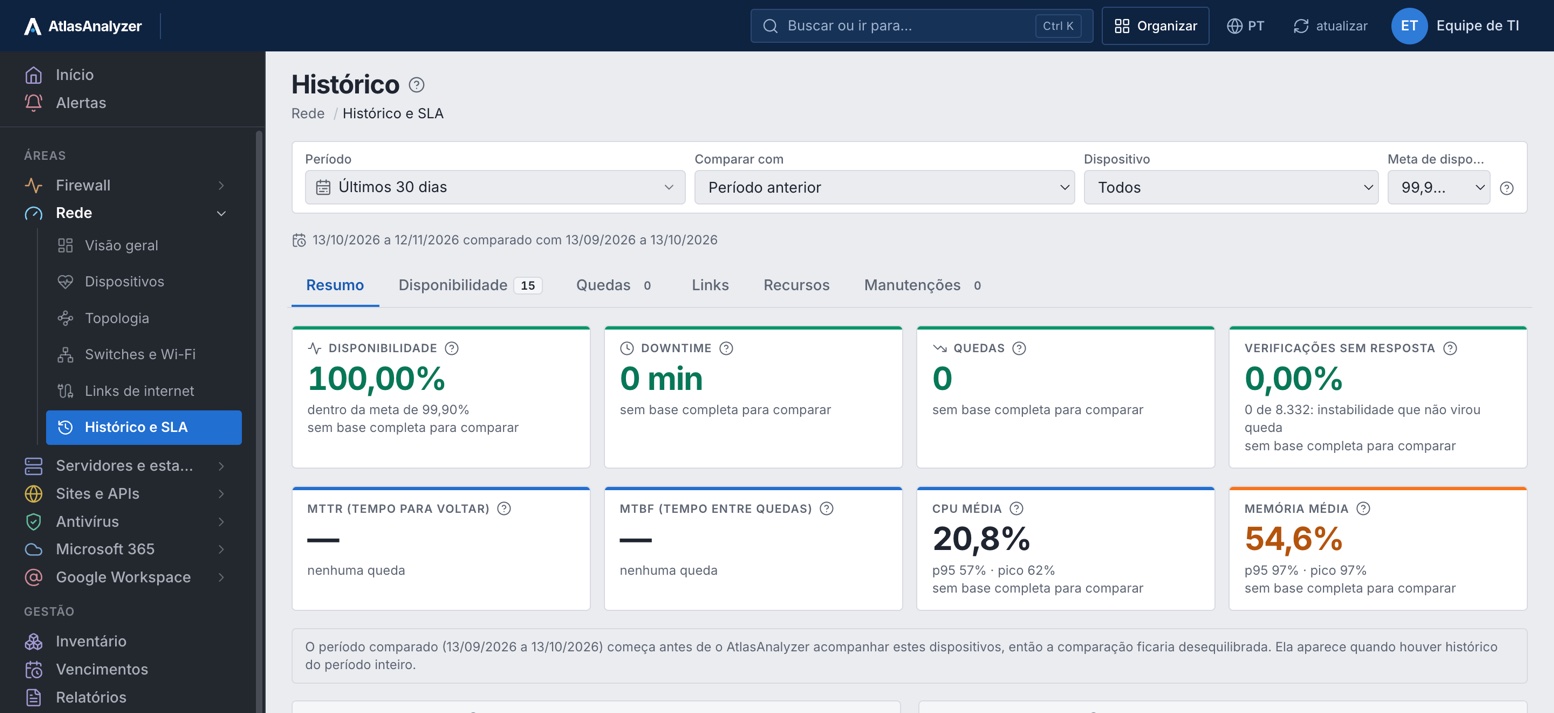
Availability against the target, outages with their cause, MTTR and MTBF, and the monthly report.
Trend in p.p. per day, saturation forecast and what is undersized.
Overview
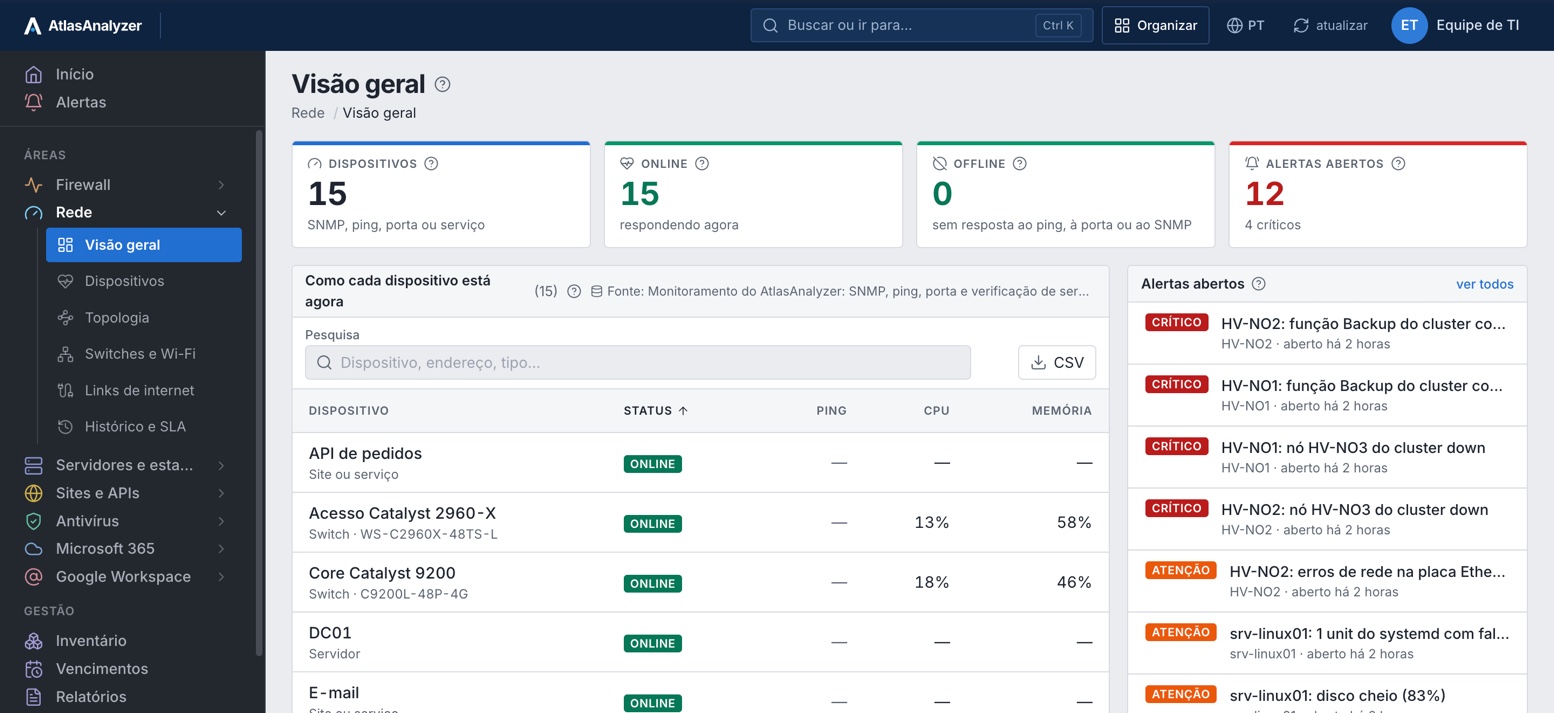
Switches, routers, servers, sites and services in one list, with the current status and open alerts alongside.
Topology
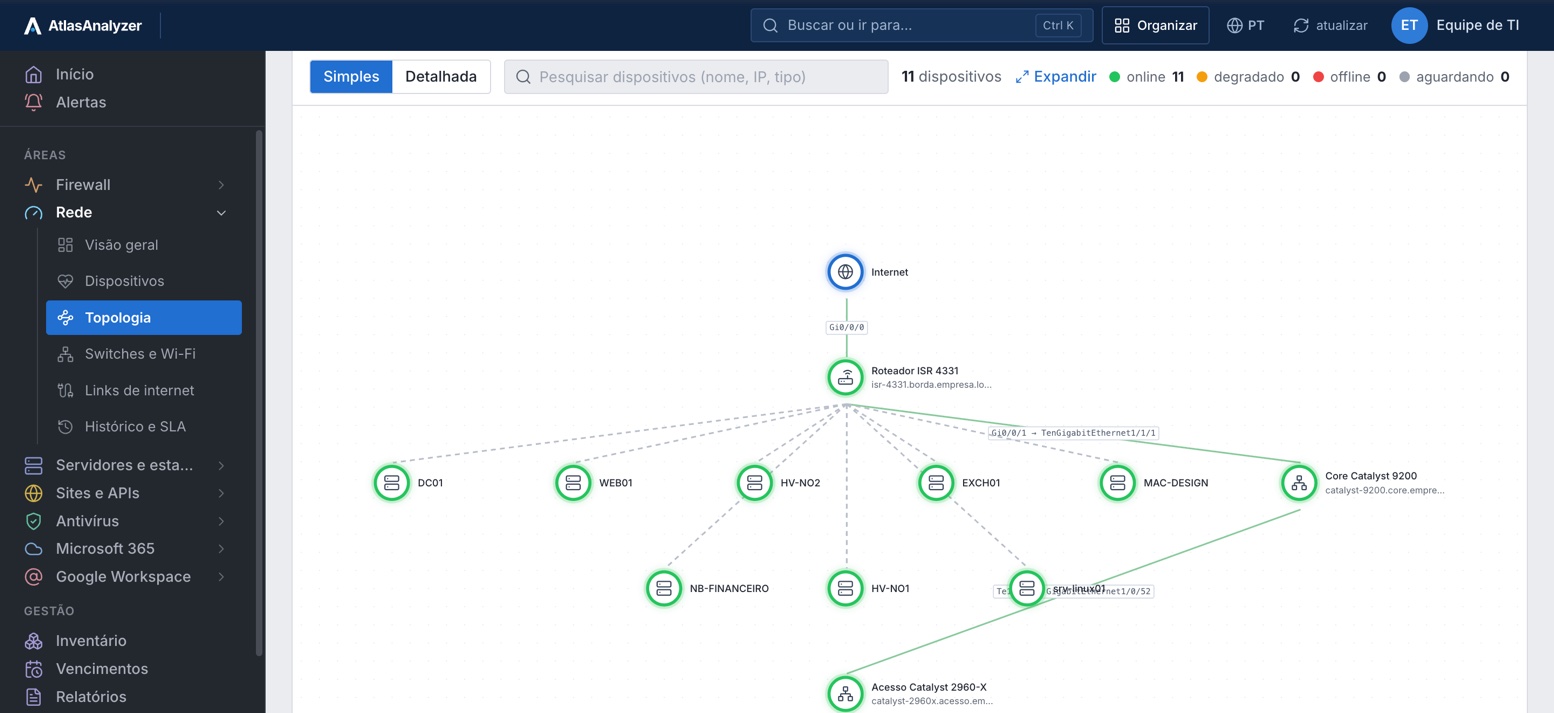
The internet, the links, the router or firewall and what is connected to it, drawn from what the devices report.
Interfaces
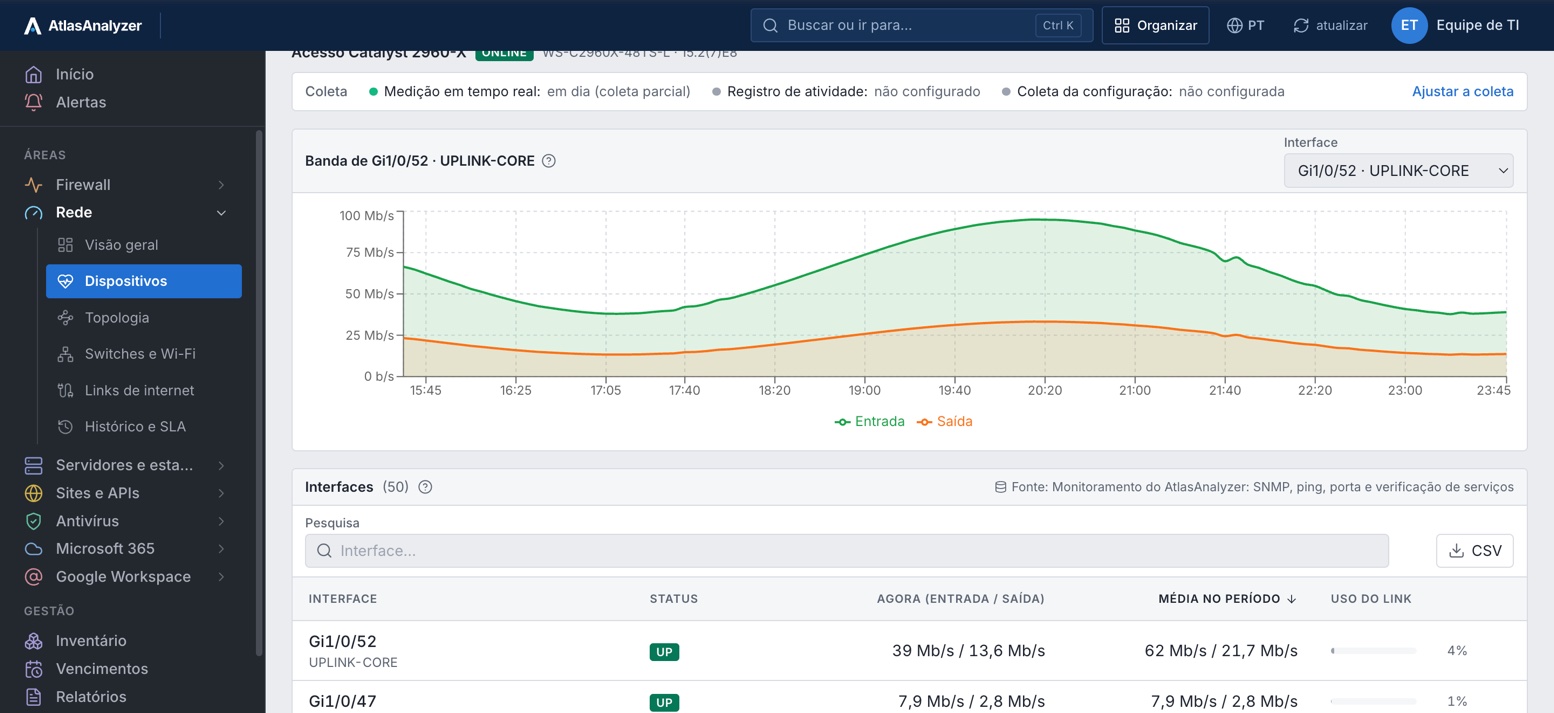
Inbound and outbound bandwidth of each port, link usage and status, read via SNMP every minute.
Internet links
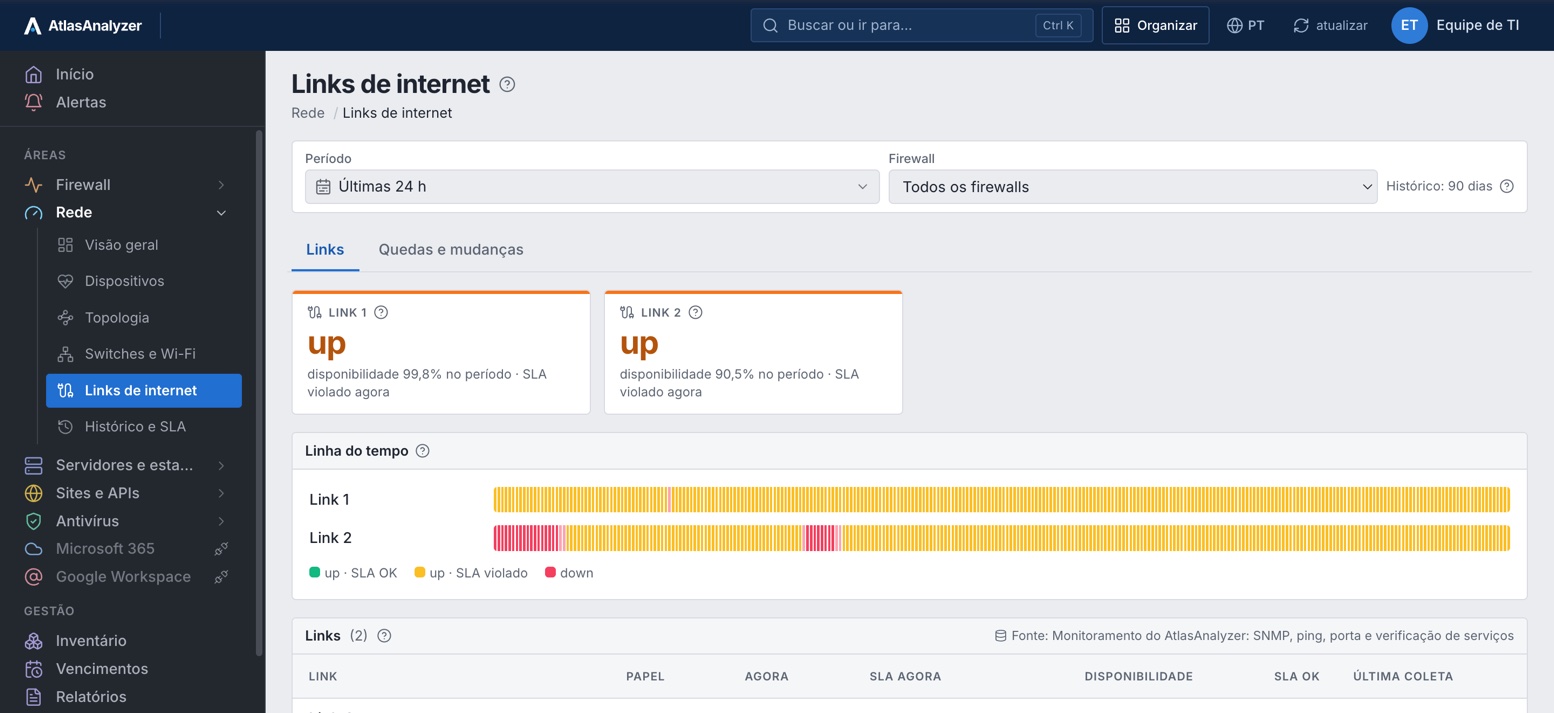
Each link with its availability, current SLA and the period's timeline, ready to show your carrier.
History and SLA
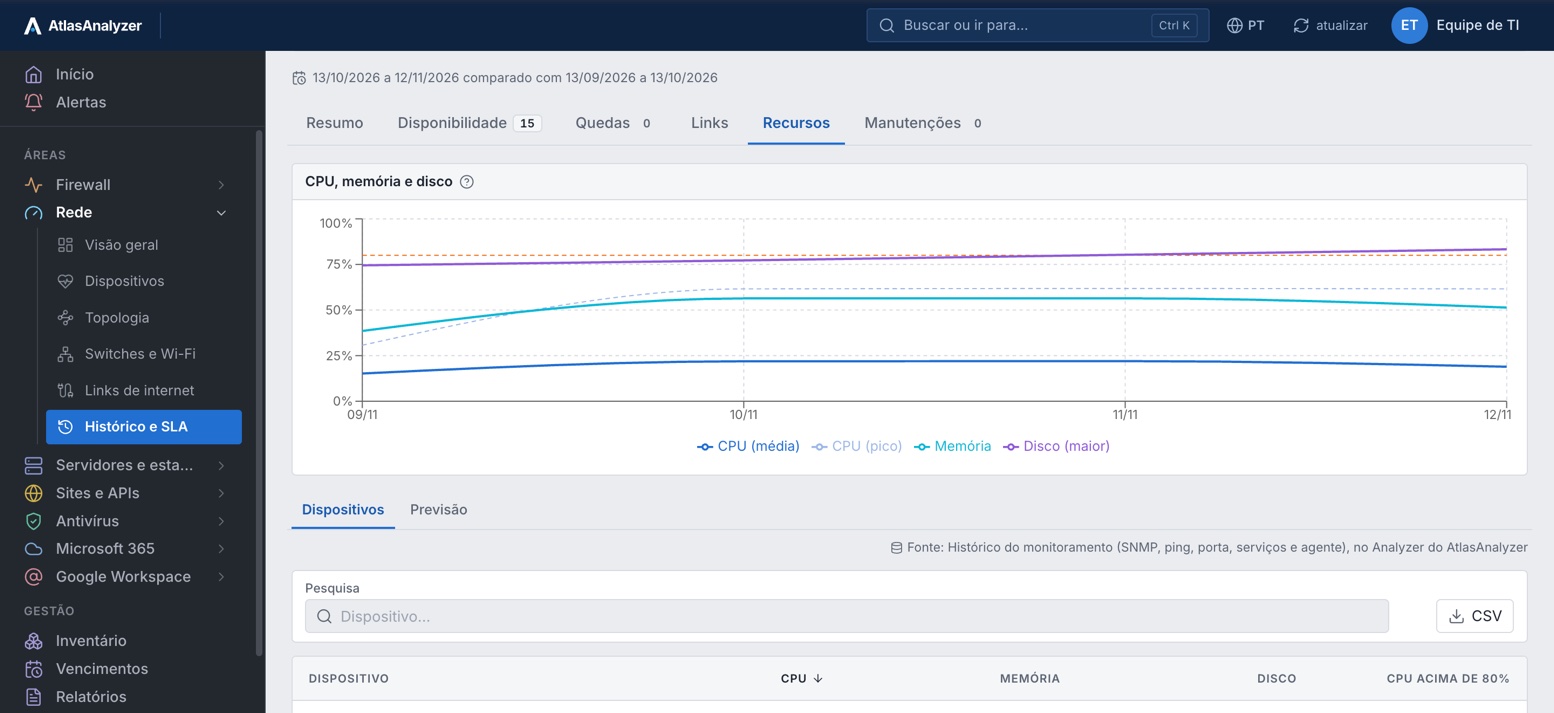
How the environment behaved in the period and against another, with CPU, memory and disk of each device.
See Network with your own environment's data
Everything AtlasAnalyzer tracks on your network devices, over SNMP, SNMP traps, NetFlow, sFlow, API, ping and port checks, in 29 features.
Online and offline status and uptime of every device, checked every minute.
Ready-made profiles for Sophos, Fortinet, SonicWall, pfSense, MikroTik, Cisco, HP, F5, Citrix, Synology, QNAP and more, with SNMPv3 by default.
Each device's resources, with its own threshold and alert.
Temperature, fans and power supplies, with what the device itself flags as warning or critical.
F5 BIG-IP and Citrix ADC: each virtual server and pool up, down or degraded, active members, sessions and HA.
Synology and QNAP: each volume with its usage and degraded RAID, each disk with its status and temperature, fans and power supplies.
Battery, runtime, load and when the UPS switches to battery.
Toner and supplies, pages printed and the status of each printer.
Bandwidth, CPU and interfaces read straight from the firewall while the screen is open.
Interfaces up and down, traffic, errors and PoE for every port.
Availability, latency, loss, jitter and SLA for each link, and when it went down and up.
Latency, loss and the ports that respond at the registered addresses.
Meraki, UniFi, Omada, Aruba and Ruckus through the API, plus those managed by FortiGate and SonicWall: status, model, firmware and clients.
VPN tunnels up and down, HA node changes and the expiration of firewall licenses.
NetFlow, IPFIX and sFlow from the router, switch or firewall: top talkers, destinations, applications by port and conversations. In AtlasAnalyzer Analytics.
The internet, the links, the firewall with its WAN and LANs, and the switches and APs connected to it, with the status of each.
Each connection shows where it came from: discovered via SNMP, LLDP, ARP or API, registered, or unknown.
Availability against the target, outages with their cause, MTTR and MTBF, compared with another period.
Unanswered checks that did not turn into an outage.
Who used the most bandwidth at peak and where it went, cross-referenced with the firewall log.
Trend in p.p. per day, saturation forecast and undersized or oversized devices.
Windows in which an outage does not count against availability or trigger an alert.
Offline, no response to ping or SNMP, interface down, port closed, virtual server and pool down, CPU, memory, temperature and sensor.
Notification rules, on-call schedules and escalation by email, SMS, WhatsApp, Telegram, Teams and webhook.
Full screen for a video wall, with what is offline and what nobody has acknowledged.
Interface down and restarts reported by the device itself right away, without waiting for the next poll.
SNMP, ping, port checks, SNMP traps, NetFlow and sFlow inside the customer; to the internet, only the outbound HTTPS connection.
Pick the type and vendor, and AtlasAnalyzer uses the right collection profile and shows what each channel collects.
Whatever the device does not answer shows as not collected, never as zero.
No agent on the switches and no scanning: AtlasAnalyzer only checks what is registered.
On a machine in the network, with the configuration AtlasAnalyzer generates; it only goes out over HTTPS.
Pick the type and vendor; the catalog uses the right SNMP profile.
Meraki, UniFi, Omada, Aruba and Ruckus through the API, with a read-only user.
The screens, the map, alerts in your team's channel and the SLA report.
Whatever a device does not answer shows as not collected, never as zero.
CPU, memory, fans, power supplies, temperature, interfaces, PoE and neighbors
—
—
Switches, APs, firmware and clients, through the Dashboard API
Interfaces, PoE and neighbors, like any switch
Switches, APs, firmware and clients, through the controller
Interfaces, PoE and neighbors, like any switch
Switches, APs and clients, through the OpenAPI
CPU, memory, interfaces, PoE and neighbors
Switches and APs, through Aruba Central
—
APs and clients, through the public API
Version, temperature, memory and interfaces
—
Health, sessions, HA and IPsec tunnels
FortiSwitch, FortiAP and Wi-Fi clients
Health, connections and VPN associations
The SonicWave access points it manages
Virtual servers, pools, sessions, HA, CPU, memory and sensors
—
Volumes, RAID, disks with status and temperature, CPU and memory
—
Battery, runtime, load and alarms; toner, pages and status
—
No. Just enable SNMP on them; the probe, on a machine in the network, handles SNMP, ping and port checks.
No. Over SNMP it only reads (GET and WALK, never SET), and the APIs use a read-only user.
No. It only checks registered addresses; the map comes from what devices already know, such as LLDP and ARP.
It shows as not collected, with what to do, and never as zero.
In AtlasAnalyzer Monitor and in Analytics.
In a 30-minute demo, our team shows you AtlasAnalyzer with sample data from the sources you use.
